
How to Model SBA 504 Loan Structures for Owner-User Commercial Purchases
An SBA 504 loan structures an owner-user commercial purchase across three funding layers: a Conventional First Mortgage (50%) from a private lender, a CDC Debenture (40%) from a Certified Development Company, and Owner-User Equity (10%) from the acquiring business. That 10% is the number buyers lead with. It is also the least revealing number in the model.
The capital structure has a surface story. Three numbers — 50, 40, 10 — and a fixed-rate debenture with fully amortizing terms of 10, 20, or 25 years. Clean. Manageable. Deceptively simple.
What those three numbers don't tell you is whether buying beats leasing, whether the occupancy requirements fit your operating model, or whether the equity you're committing works harder inside the building than it would inside the business.
To qualify, the acquiring business must occupy at least 51% of an existing commercial building — or 60% of a new construction. That threshold isn't a formality. It determines which buildings are even eligible and how the entire deal gets structured.
Pair that with the job creation requirement — one job created or retained per $75,000 of SBA-guaranteed debenture — and the picture is already more complex than any standard loan comparison shows.
The Certified Development Company managing the 40% debenture is a non-profit entity certified and regulated by the SBA. That regulatory layer affects closing timelines, documentation sequencing, and approval order — all of which feed into the true cost of the transaction.
Commercial real property depreciates over 39 years under MACRS guidelines. That single fact reshapes the after-tax cash flow model. Most buyers never run it against the lease alternative before signing.
Modeling this correctly means running all of it together: the capital split, the occupancy rules, the 39-year depreciation schedule, the true cost of equity, and what that same submarket would cost in rent over the same period. Three numbers are the beginning of the model, not the end of it.
Last Updated: August 24, 2026
- • The 50-40-10 Capital Stack: What Each Layer Actually Does
- • SBA 504 Eligibility: The Occupancy and Job Creation Thresholds That Decide the Deal
- • Building the Lease-vs-Buy Model: What a Generic Template Gets Wrong
- • MACRS Depreciation and Cost Segregation: The Tax Layer Most Models Skip
-
• Frequently Asked Questions About SBA 504 Loan Modeling
- • What is the exact capital structure of an SBA 504 loan?
- • How does the 51% occupancy rule affect the owner-user purchase model?
- • What are the job creation requirements for SBA 504 loans?
- • How does cost segregation affect the cash flow model of a commercial purchase?
- • Why is a standard lease-vs-buy model insufficient without Southern California rent projections?
- • What a Complete SBA 504 Model Actually Tells You
The 50-40-10 Capital Stack: What Each Layer Actually Does

The three numbers — 50, 40, 10 — describe who puts in what(https://www.sba.gov/sba-lenders/). They don't describe what each party wants, what each party is on the hook for, or how those obligations collide when the deal gets complicated.
That gap is where most buyers lose money.
Most buyers treat the capital stack as a financing mechanic and stop reading.
That's a mistake. There are three parties in this deal, and they don't all want the same outcome. The structure doesn't behave like a single-lender loan — not at underwriting, not at close, and not when something goes sideways.
Why the Conventional Lender and the CDC Don't Want the Same Things
The conventional first mortgage covers 50% of the project. A bank or credit union underwrites it against the metrics they've always used: debt service coverage, loan-to-value, and the creditworthiness of your operating business.
That lender holds senior position. Their collateral is secured. Their approval runs on their timeline — not the SBA's, not the CDC's. They finish when they finish.
The CDC debenture covers 40%. Certified Development Companies are non-profit corporations certified and regulated by the SBA to package, close, and service 504 loans.
They sit in second-lien position — junior to the bank. Their documentation requirements and closing sequences don't run parallel to what the private lender needs. When those two timelines fall out of sync, closings extend. That coordination cost is real, and generic purchase models never build it in.
Buyers who are still deciding whether ownership pencils out at all should run a full lease-versus-buy comparison before touching a term sheet — because the coordination risk alone changes the break-even math.
The owner-user equity is 10%. Smallest number in the stack. Most consequential one in the model.
That 10% is permanent capital deployed. It leaves your operating business's balance sheet on day one. It doesn't come back until a refinance or a sale — not after year one, not after year three.
So the real question isn't whether 10% is affordable. The question is what that same capital produces inside the business versus what it produces inside the building across a 20-year or 25-year fully amortizing term. Three numbers open the model. They don't close it.
| Capital Layer | Source | Share of Total Project Cost | Lien Position | Typical Rate Structure | Amortization Term |
|---|---|---|---|---|---|
| Conventional First Mortgage (50%) | Private lender (bank or credit union) | 50% of total project cost | First lien (senior position) | Variable or fixed; set by private lender | Negotiated with private lender |
| CDC Debenture (40%) | Certified Development Company (CDC) — non-profit, SBA-regulated | 40% of total project cost | Second lien (junior position) | Long-term fixed rate | 10, 20, or 25 years — fully amortizing |
| Owner-User Equity (10%) | Acquiring business (owner-user) | 10% of total project cost | No lien — permanent capital deployed | Not applicable — equity contribution | Not applicable — deployed on day one |
SBA 504 Eligibility: The Occupancy and Job Creation Thresholds That Decide the Deal
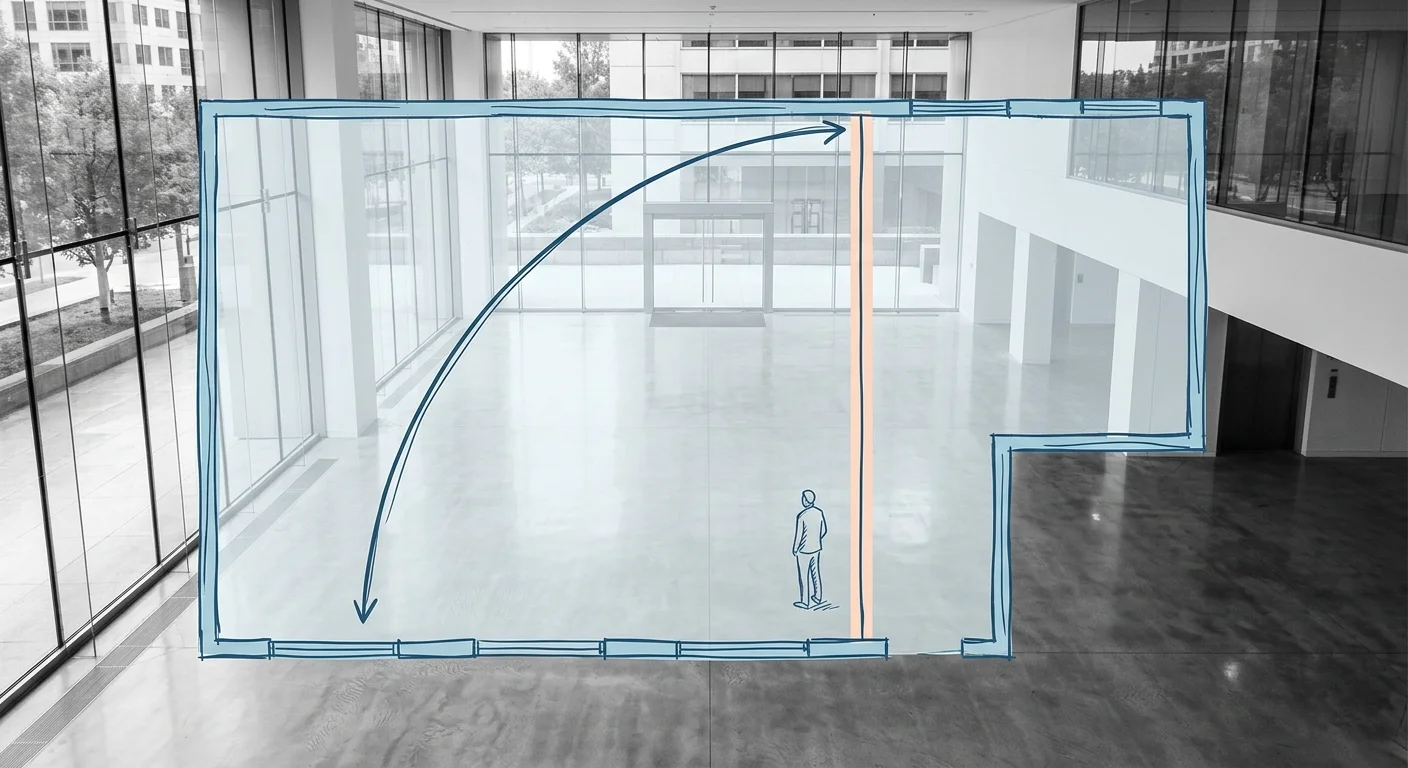
The capital stack tells you how the money works. The eligibility rules tell you whether the deal exists.
Most owner-users learn about the occupancy and job creation thresholds from a lender — after they've already picked a property. That sequencing costs time. Sometimes it costs the building.
Two requirements decide whether the 504 structure is available at all. Miss either one and the model is irrelevant. Get them right and they become inputs — constraints you design around, not walls you hit after the offer is signed.
The 51% Rule and What It Means for Partial-Use Buildings
The occupancy rule is binary. Per SBA occupancy guidelines, the acquiring business must occupy at least 51% of an existing commercial building, or 60% of a newly constructed one. There is no sliding scale. You clear the threshold or you don't qualify.
That 51% floor has direct consequences for mixed-use buildings. A business buying a property and planning to lease a significant portion to third parties may not qualify — or may need to restructure the deal to clear the threshold.
The leased square footage isn't the problem. The ratio of owner-occupied space to total building is. That distinction changes which buildings make the shortlist.
Here's where the comparison to leasing becomes unavoidable. A business that can't clear the 51% threshold in its target building loses 504 access entirely — falling back on a conventional commercial mortgage with a higher down payment, or staying a tenant.
Understanding why ownership builds equity that leasing never returns matters most precisely when the occupancy question forces the decision into the open. That forced comparison is where the real modeling begins.
Job Creation Requirements: The Benchmark That Surprises Most Borrowers
The job creation requirement catches most borrowers off guard. Per SBA development company standards, the project must create or retain one job per $75,000 of SBA-guaranteed debenture. On a large acquisition, that adds up fast.
The math runs against the CDC Debenture — the 40% tranche — not the total purchase price. A $2 million debenture requires 26 or 27 jobs created or retained.
Most growing businesses can hit that number. Lean operating models need to verify the headcount before the commitment is made. Not after.
Job retention counts. It doesn't have to be net-new hiring. But the documentation burden is real, and the SBA holds the CDC accountable.
Buyers who treat the job creation requirement as a formality discover it becomes a condition of funding. Run the headcount analysis before the letter of intent — not after it's signed.
| Eligibility Criterion | Existing Building Threshold | New Construction Threshold | Consequence of Non-Compliance |
|---|---|---|---|
| Occupancy Requirement | 51% of total square footage occupied by the acquiring business | 60% of total square footage occupied by the acquiring business | Deal structure collapses — business loses access to SBA 504 and must pursue conventional financing or continue leasing |
| Job Creation / Retention | 1 job created or retained per $75,000 of SBA-guaranteed debenture | 1 job created or retained per $75,000 of SBA-guaranteed debenture | Funding condition not satisfied — CDC cannot close the debenture until headcount compliance is documented and verified |
Building the Lease-vs-Buy Model: What a Generic Template Gets Wrong
Eligibility confirmed. Now the real work starts.
Most owner-users arrive at this stage with a generic lease-vs-buy template — purchase price, down payment, monthly payment. Three inputs. A clean output.
That isn't analysis. It's a mortgage comparison wearing a spreadsheet's clothes.
That 10% equity looks manageable on the term sheet. It stops looking manageable the moment you trace where it came from.
That capital leaves the operating business permanently on closing day. A generic template never asks what it was earning inside the business before it left. It doesn't ask what it costs the company to run without it. Both questions belong in the model.
The Four Inputs a Standard Model Ignores
The 51% occupancy minimum isn't a footnote. It's a filter that cuts through available inventory before you've run a single rent comparison.
Most buyers find out about it three weeks into underwriting. By then, the building they wanted may already be gone. That constraint belongs at the top of the model — not buried in the lender's conditions package.
The second input the standard model skips is the actual lease alternative. Not a national average. Not a regional index. What a landlord in that specific submarket is offering on a comparable footprint right now.
In markets where Los Angeles County rents threaten renewal leverage, the lease side of the comparison shifts materially year over year. A model built on stale rent data doesn't produce a conservative estimate. It produces the wrong decision.
The third missing input is the true cost of that 10% equity. Not the dollar amount — the opportunity cost.
That capital had a return inside the operating business before it moved into the building. If the company generates strong returns on working capital, the equity going into real estate has a hurdle rate. Most templates never set one. They treat the down payment as money spent, full stop. Owner-occupied commercial real estate outperforms leasing over the long hold — but only when that hurdle rate is built into the comparison from day one.
The fourth input is the after-tax picture. And this is where the generic template breaks down entirely.
The Conventional First Mortgage interest — 50% of the capital stack — is deductible. The CDC Debenture interest — 40% of the stack — is deductible. But commercial real property depreciates over 39 years under MACRS, and the interaction between that schedule, qualified improvement property, and the operating company's actual tax position requires inputs a generic spreadsheet never requests.
Skip those inputs and you've understated the purchase's true economics. Sometimes by enough to reverse the decision.
| Model Input | Generic Template Treatment | Accurate Southern California Treatment | Impact on Break-Even Analysis |
|---|---|---|---|
| Eligible building inventory | Treats all available listings as comparable options | Filters inventory first against the 51% occupancy threshold, then runs the rent comparison on qualifying properties only | Eliminates a portion of the building set before analysis begins — narrows the real decision set significantly |
| Lease alternative benchmark | Uses national average or regional index rent figures as the comparison baseline | Uses live asking rents in the specific Southern California submarket, adjusted for current concession conditions and renewal leverage dynamics | Stale rent assumptions can shift the break-even point by years — and recommend the wrong decision |
| Owner-User Equity (10%) cost | Records the equity contribution as a one-time sunk cost — money spent to enter the building | Models the equity as capital with an opportunity cost: compares the building's projected return against the rate that same capital generates inside the operating business | A business with strong working capital returns faces a real hurdle rate — missing it makes the purchase look cheaper than it is |
| Mortgage interest deductibility | Applies a flat deduction estimate across the full loan balance without distinguishing between the two debt layers | Separates the Conventional First Mortgage (50%) and CDC Debenture (40%) interest deductions and maps each against the operating company's actual tax position | Blended treatment understates the after-tax benefit — or overstates it depending on the business's marginal rate |
| Depreciation and improvement property | Applies the standard straight-line depreciation schedule across the full acquisition cost | Identifies qualified improvement property and cost segregation opportunities that accelerate deductions beyond the standard schedule | Missing this input understates the purchase's true after-tax economics — sometimes by enough to reverse the lease-vs-buy conclusion |
MACRS Depreciation and Cost Segregation: The Tax Layer Most Models Skip

The building isn't just an asset you occupy. It's a tax instrument. And whether it performs like one depends entirely on whether you model the depreciation correctly from day one.
Most owner-user models acknowledge depreciation. They don't model it. Applying a standard 39-year straight-line schedule and running a real cost segregation study aren't two ways to get the same answer — they're two different models, and only one of them is actionable.
39-Year Straight-Line vs. Cost Segregation: How the Timelines Diverge
Standard MACRS puts commercial real property on a 39-year straight-line schedule. Same deduction, every year, for 39 years — no variation, no front-loading, no acceleration. It's simple. And a generic spreadsheet will never run anything else.
Cost segregation breaks that 39-year schedule apart. An engineering-based study reclassifies building components — electrical systems, specialized flooring, certain HVAC elements — as personal property or land improvements. Those components carry 5-, 7-, or 15-year depreciation schedules instead. The acceleration is front-loaded. That means the tax benefit lands early: in the first years of ownership, right after the Owner-User Equity (10%) has left the balance sheet and the business needs capital most.
Rent is fully deductible as an operating expense. That makes it look like a fair trade against ownership's deductions. It isn't. The depreciation versus rent write-off calculation is one of the most underexamined variables in any owner-user purchase — because depreciation is a non-cash deduction. It offsets taxable income without leaving the bank account. Rent can't do that. And per IRS Publication 946, qualified improvement property can bypass the 39-year timeline entirely. That's another layer of acceleration a standard template never captures.
The Equity Cost Calculation That Most Owner-Users Skip
The depreciation analysis connects to the equity question. And the equity question is the one most buyers answer wrong. The Owner-User Equity (10%) that goes into the building on day one has a cost. Buyers call it a price of admission. The accurate term is a hurdle rate.
That 10% leaves the operating business permanently. It doesn't sit in escrow while underwriting runs. It converts from liquid working capital into illiquid real estate equity, and the business absorbs that conversion on day one. So the model has to answer two questions: what was that capital earning inside the business before it left, and does ownership outperform that rate over the full holding period?
For Los Angeles tenant representation clients weighing this in high-cost Southern California submarkets, the equity cost calculation isn't a theoretical exercise. It's the number the decision turns on. A business with strong working capital returns faces a real hurdle that ownership must clear. A business operating in a submarket where lease rates are escalating fast faces a different calculation entirely. Both need an explicit equity cost figure in the model. Without one, the purchase decision isn't analyzed. It's guessed.
| Asset Category | Depreciation Method | Recovery Period | Benefit Timing | Interaction with SBA 504 Financing |
|---|---|---|---|---|
| Commercial Real Property (Structure) | MACRS Straight-Line | 39 years | Deductions spread evenly across 39 years — benefit is predictable but back-weighted relative to the capital deployed at acquisition | Depreciable basis is the building value portion of the 504-financed purchase; the Conventional First Mortgage (50%) and CDC Debenture (40%) finance the asset, but only the Owner-User Equity (10%) represents out-of-pocket cost — depreciation offsets income regardless of which layer funded the basis |
| Qualified Improvement Property (QIP) | Accelerated / Bonus Depreciation (Section 179 eligible) | Bypasses 39-year timeline | Front-loaded — deductions arrive in early ownership years when the Owner-User Equity (10%) has just left the operating balance sheet | Accelerated deductions reduce taxable income in the same years that SBA 504 debt service is highest, improving net cash flow during the most capital-constrained period of ownership |
| Personal Property Components (via Cost Segregation) | MACRS Accelerated — 5- or 7-year schedules | 5 or 7 years | Heavily front-loaded — the largest deductions occur in years 1 through 3, creating a cash flow advantage that a standard 39-year model never captures | Reclassification requires an engineering-based cost segregation study; the resulting deductions interact directly with the CDC Debenture (40%) interest deduction — stacking tax benefits in early ownership years |
| Land Improvements (Parking, Landscaping, Site Work) | MACRS Accelerated — 15-year schedule | 15 years | Moderate front-loading — faster than the 39-year structural schedule but slower than personal property components; often overlooked in generic models | Identified through cost segregation; increases total depreciable basis available to offset income generated by the operating company occupying the SBA 504-financed building |
| Section 179 Expensing — Eligible Assets | Immediate Expensing (Year 1) | 1 year | Maximum front-loading — the entire deductible amount offsets income in the acquisition year, which is when the Owner-User Equity (10%) conversion from liquid capital to illiquid real estate equity is freshest | Subject to annual IRS limits and taxable income caps; must be modeled against the operating company's specific tax position — a generic SBA 504 template does not include this input |
Frequently Asked Questions About SBA 504 Loan Modeling
Here's what comes up most once owner-users start working through the numbers themselves.
The questions below cover the structural rules, the compliance thresholds, and the modeling variables that catch experienced buyers off guard.
The answers are direct. Where a regulation requires a qualifier, it's there. Where it doesn't, it isn't.
What is the exact capital structure of an SBA 504 loan?
Three layers. A conventional first mortgage at 50% comes from a private lender — a bank or credit union — sitting senior in the capital stack. A CDC debenture at 40% comes from a Certified Development Company, a non-profit regulated by the SBA, in second-lien position. Owner-user equity at 10% is the buyer's contribution.
That 10% is what most buyers gloss over. It shouldn't be. The moment the transaction closes, liquid working capital converts into illiquid real estate equity — and it doesn't come back until a refinance or a sale.
How does the 51% occupancy rule affect the owner-user purchase model?
The occupancy rule sets a hard floor on how much of the building the acquiring business must use. For an existing commercial property, that floor is 51%. For a newly constructed facility, it rises to 60%. There is no sliding scale.
In practice, this eliminates multi-tenant buildings where the owner-user can only secure a partial floor. It also cuts mixed-use properties where the square footage doesn't fit the business's operational footprint. That constraint belongs at the top of the model — not discovered three weeks into underwriting after the building set has already been narrowed on other criteria.
What are the job creation requirements for SBA 504 loans?
SBA 504 projects carry a job creation or retention requirement tied to the CDC debenture. The standard threshold is 1 job created or retained for every $75,000 of SBA-guaranteed debenture.
For most owner-users, this is workable — a business buying a building it already occupies has existing headcount that typically satisfies the number. But projected hires that don't materialize on schedule will not. The job count is a regulatory floor. Document it before closing, not after a compliance review flags it.
How does cost segregation affect the cash flow model of a commercial purchase?
Standard MACRS depreciates commercial real property over 39 years, straight-line. A generic model applies that schedule uniformly and calls the depreciation input complete. Cost segregation disagrees.
An engineering-based study reclassifies building components — electrical systems, specialized flooring, certain mechanical elements — as personal property or land improvements. Those components carry 5-, 7-, or 15-year schedules instead. The acceleration is front-loaded, which means the tax benefit lands in the early years of ownership — exactly when that 10% equity has just left the balance sheet and cash flow pressure is at its peak.
Per IRS Publication 946, qualified improvement property can bypass the 39-year schedule entirely. A model that skips cost segregation understates the purchase's after-tax economics. Sometimes by enough to reverse the decision.
Why is a standard lease-vs-buy model insufficient without Southern California rent projections?
A standard lease-vs-buy model treats the lease side as a fixed input — a number pulled from a market report or quoted by a landlord. That isn't a lease comparison. It's a placeholder.
The lease alternative that belongs in the model is the actual rent a landlord in the specific submarket will offer on a comparable footprint right now. Not a regional average. Not last quarter's comp. In Southern California submarkets where rent escalation is compressing renewal options, the lease side of the comparison shifts materially year over year.
The 51% occupancy threshold already narrows the eligible building set. If the lease comparison is also approximate, two critical inputs are working against the model's accuracy at the same time. Both have to be current, specific, and tied to real available options — or the output tells you nothing actionable.
What a Complete SBA 504 Model Actually Tells You
A complete SBA 504 model doesn't tell you whether to buy. It tells you what the decision actually costs — and whether the building earns it.
The 50-40-10 capital split is where most buyers stop. That's not a model. That's a term sheet.
The real answer lives downstream. In the occupancy threshold that narrows your building set before underwriting even starts. In the submarket lease rate that tells you whether ownership saves money or just moves the cost. In the 39-year depreciation schedule that reshapes after-tax cash flow year by year. In the equity cost figure that sets the one hurdle everything else has to clear.
That 10% equity contribution is the number most buyers examine last. It should be the first number they interrogate.
It leaves the operating business on day one — permanently. Not temporarily. It doesn't sit in escrow while underwriting runs. It converts from liquid working capital into illiquid real estate equity, and every other variable in the model exists to justify that conversion.
The 50% conventional first mortgage, the 40% CDC debenture, the occupancy rules, the job creation count, the depreciation timeline — none of those numbers mean anything without an explicit rate of return the building has to beat.
Skip that question and you don't have a model. You have a payment schedule dressed up as analysis.
Peninsula Commercial Real Estate Group runs this analysis because the lease-vs-buy decision in a high-cost Southern California submarket is too consequential to run on a generic template.
The businesses that get this right aren't the ones who move fastest. They're the ones who built the model completely — occupancy threshold, submarket lease comparison, true equity cost, after-tax depreciation schedule — before they signed a letter of intent.
Three numbers are the beginning of the model, not the end of it. The owners who treat them as the end find out later, on a balance sheet that doesn't lie, exactly what that shortcut cost them.
That work doesn't happen on its own. Current submarket lease data. A real equity cost figure. A depreciation analysis that actually runs cost segregation. An occupancy check before the building search narrows. That's the model — and three numbers on a spreadsheet aren't close to it. If you're weighing an owner-user purchase in Southern California and none of that is done yet, start here.